
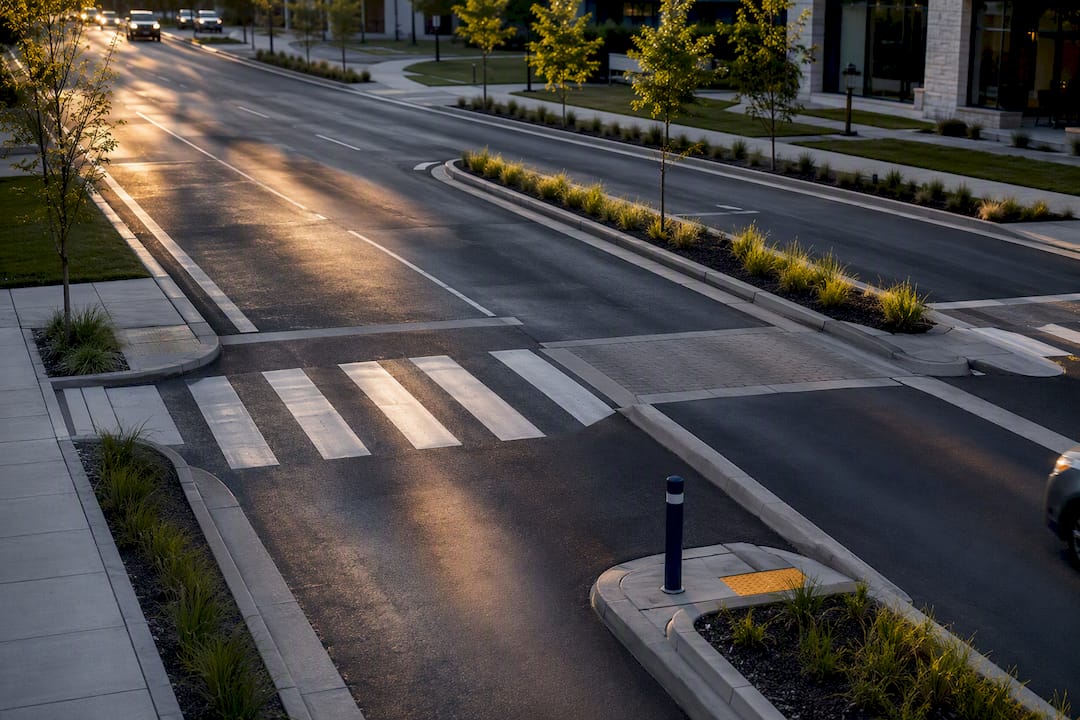
The evidence points to one integrated answer: pair engineering that redesigns roads to be self-explanatory with targeted automated speed enforcement, inside a Safe System process that sets and reviews target speeds. Safety cameras alone cut death and serious injury crashes by 47% at treated intersections in Victoria, Australia. Combine that enforcement with road design fixes and public education, and agencies get faster, more durable results than any single tactic delivers alone.
TL;DR:
- Combining physical road redesigns with automated enforcement and community education produces more durable safety improvements than using each tactic alone.
- Effective engineering solutions include road diets, raised crosswalks, roundabouts, and gateway treatments that physically reduce operating speeds.
- Visible and predictable automated speed enforcement, especially point-to-point systems, significantly decreases long-term speeding and crash severity when paired with public transparency.
- Speed management should follow a Safe System approach, setting target speeds based on crash survivability rather than current driver behavior, supported by data-driven prioritization.
- Community engagement, enforcement visibility, and paired measurement are critical to gain public support and accurately assess progress of speed reduction programs.
Table of Contents
- Why Speeding Prevention Strategies Start With Physics, Not Willpower
- What Engineering Tactics Lower Operating Speeds?
- How Effective Is Automated Speed Enforcement?
- Which Campaigns Actually Change Driving Behavior?
- How Does the Safe System Approach Guide Speed Policy?
- Where Should Agencies Act First and How Do They Measure Results?
- What Does the Evidence Say About Speeding Countermeasures?
- How Drive With Care Supports Local Speed Reduction Efforts
- An Author’s Take on Fixing How Cities Treat Speed
- How to Bring Speed-Reduction Programs to Your Community
- Sources
Why Speeding Prevention Strategies Start With Physics, Not Willpower
Speed does not scale crash risk in a straight line. Kinetic energy rises with the square of velocity, so a car traveling 40 mph carries roughly 78% more energy than one at 30 mph, and that energy has to go somewhere in a collision. Stopping distance grows the same way: a driver going 10 mph faster needs a disproportionately longer distance to react and brake, which is why urban speed increases translate into outsized jumps in pedestrian and cyclist fatalities.
The scale of the problem is not marginal. Speeding contributes to a substantial share of fatal crashes nationwide every year, which is why federal agencies treat speed management as a core pillar of traffic safety rather than a secondary concern.
The normalization problem: Most drivers do not see speeding as dangerous, they see it as routine. That gap between perceived risk and actual risk is the real target of any prevention effort.
Understanding why people speed matters as much as understanding the physics. A 2026 AAA Foundation study found drivers most often speed to get around slower traffic (31%), reach a destination faster (25%), and avoid holding up other vehicles (21%). The same research found 79% of drivers said the threat of a ticket would make them slow down, and 72% would slow to avoid a crash. That is a workable opening: most drivers respond to visible risk and visible enforcement. They just do not perceive their own speeding as risky until something makes them.
What Engineering Tactics Lower Operating Speeds?
Signs alone rarely change behavior. Drivers read the road, not the sign, which is why research on road environment and speed perception consistently finds that changing the physical environment reduces operating speeds more reliably than posting a lower limit on an unchanged road. If a four-lane collector feels like it was built for 45 mph, most drivers will drive close to 45 mph regardless of the sign.
The toolkit varies by road type and traffic function:
- Residential streets: speed humps, mini roundabouts, chicanes, and curb extensions that narrow the visual field and force lower approach speeds.
- Collector roads: road diets (reducing four lanes to three, with a center turn lane), lane narrowing, and raised crosswalks at high-pedestrian points.
- Arterials: roundabouts at high-crash intersections, median islands, and access management to reduce conflict points without eliminating capacity.
- All contexts: gateway treatments at neighborhood entrances and dynamic speed feedback signs that give drivers real-time comparison against the posted limit.
Roundabouts deserve particular attention because they solve two problems at once: they force lower entry speeds through geometry rather than compliance, and they cut the angle and severity of the crashes that still occur. A systematic review of speed-management strategies lists road design changes alongside posted limits and enforcement as one of the consistently effective categories.
Alignment matters more than any single treatment. Design speed, posted speed limit, and target speed should all point the same direction. When a road is engineered for 50 mph but posted at 30 mph, the sign loses. This mismatch is one of the most common and correctable errors agencies make, and it is exactly the kind of gap the Safe System framework, discussed further below, is built to catch.
Pro Tip: Before proposing a permanent redesign, test the concept with temporary materials, planters, paint, and flexible delineators, for 60 to 90 days. It builds community support and gives you real speed data before you commit capital funding.
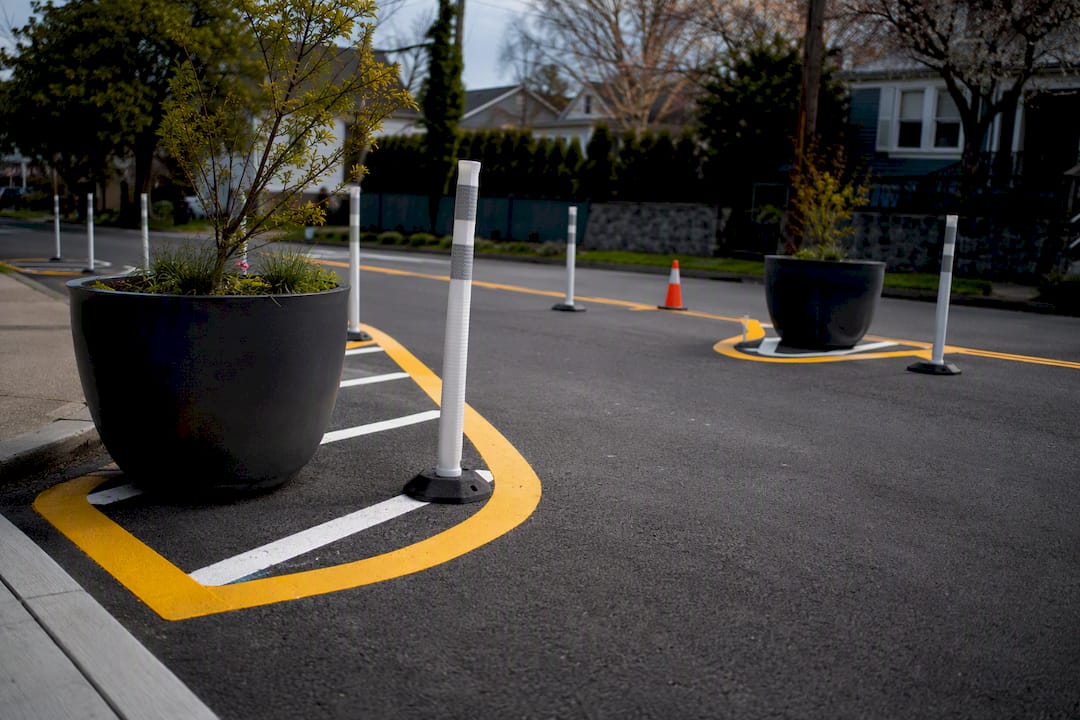
Community acceptance is not automatic. Road diets and lane narrowing sometimes draw pushback from residents who equate more lanes with less congestion, even when the data shows otherwise. Equity matters too: crash and speed data should guide where treatments go first, not just which neighborhoods can lobby loudest. Maintenance costs also differ sharply, a raised crosswalk needs snow-plow coordination in cold climates, while a roundabout needs landscaping upkeep that a four-way stop never required.
How Effective Is Automated Speed Enforcement?
Enforcement works best when it is visible, predictable, and aimed at documented risk, not random patrol. High-visibility enforcement, marked units at known speeding corridors during peak violation hours, changes driver behavior on the corridor itself and, when paired with public communication, shifts behavior more broadly across a jurisdiction.
Automated speed enforcement (ASE) is where the strongest recent evidence sits. Three main types are in active use:
- Fixed cameras, installed permanently at a documented high-risk location, typically a school zone, construction zone, or crash cluster.
- Mobile units, deployed on a rotating schedule across multiple corridors, useful where budgets can’t support permanent fixed installations everywhere.
- Point-to-point (average speed) systems, which measure speed over a stretch of road rather than a single point, discouraging the brake-and-accelerate pattern drivers use around fixed cameras. Point-to-point enforcement substantially reduces long-run corridor speeding but remains underused in the United States due to legal and operational constraints that vary by state.
The evidence for ASE is not marginal. The Victoria camera program’s 47% reduction in death and serious injury crashes at treated intersections sits alongside a broader state strategy that increased mobile camera hours by 75% and paired enforcement with public campaigns and funding incentives. The NTSB’s safety study on speeding-related crashes names automated speed enforcement and intelligent speed adaptation among the top-priority countermeasures the country has been slow to adopt at scale.
Operational credibility depends on transparency. Public acceptance of automated enforcement rises when programs post clear signage, target documented high-risk locations, and publish results, rather than functioning as a quiet revenue mechanism. Legal constraints differ by state and jurisdiction, so any program needs review against local statute before deployment. Performance measurement should track violation rates, speed distribution shifts, and crash outcomes at treated sites, not just citation counts or revenue.
Which Campaigns Actually Change Driving Behavior?
Messaging fails when it lectures. It works when it corrects a specific, false belief a driver already holds. The AAA Foundation research on time pressure found that roughly 35% of drivers cite time pressure as a main reason to speed, while consistently overestimating the time they actually save. On most trips, the real gain is a matter of tens of seconds. A campaign that shows a driver the actual math, not just a warning about danger, tends to land better than a fear-based appeal alone.
Effective programs generally combine several approaches rather than relying on one:
- Safety-framed messaging that avoids shaming language and instead corrects specific misconceptions, like the time-savings myth, with concrete comparisons.
- Community pledge campaigns that ask drivers to make a public, personal commitment rather than simply absorbing a warning.
- School-based programs paired with parent-teen driving agreements, which extend the message into the household where new drivers form habits.
- Employer and fleet programs that hold organizations accountable for driver behavior tied to work travel, a segment with disproportionate exposure to time-pressure speeding.
- Joint campaigns with enforcement rollouts, announcing an enforcement period in advance rather than running it silently, which research consistently shows improves both compliance and public acceptance of the enforcement itself.
Community engagement resources, including volunteer and safety ambassador programs, help extend campaign reach beyond what an agency’s communications budget alone can cover.
Track reach (impressions, event attendance, pledge signatures) separately from behavior change (measured speed shifts, self-reported attitude surveys, citation trends). A campaign can hit every reach target and still fail to move actual speeds if it is not paired with a visible enforcement or design change on the ground.
How Does the Safe System Approach Guide Speed Policy?
The FHWA’s Safe System Approach for speed management lays out a five-stage process: establish a vision for acceptable risk, collect and analyze data, prioritize locations, select countermeasures, and monitor and adjust. It treats speed as a design variable to be managed at the network level, not a behavior to be scolded out of individual drivers.
The core policy shift is target-speed setting. Instead of asking “what speed do most drivers currently choose,” Safe System asks “what speed keeps a crash survivable for the road users present,” then works backward to align design and posted limits with that answer. The USDOT’s framing of the Safe System Approach makes clear this requires coordinating design, enforcement, and posted limits toward one shared target rather than managing each in isolation.
Practical steps agencies can adopt now:
- Run engineering speed studies before setting or changing a limit, rather than defaulting to the 85th percentile speed of current traffic, which just ratifies existing speeding.
- Use a documented protocol, similar in spirit to the USLIMITS2 approach, to justify limit changes with consistent criteria rather than ad hoc judgment calls.
- Set measurable KPIs tied to the vision, mean speed, 85th percentile speed, and fatal/serious injury counts, not just citation volume.
- Build stakeholder engagement into the process early. Residents, business owners, and transit operators all experience a road diet or lower limit differently, and unaddressed tradeoffs are what stall projects politically.
This is where a nonprofit partner adds real value, translating “target speed” and “Safe System” into language a city council or neighborhood association can act on without a transportation degree.
Where Should Agencies Act First and How Do They Measure Results?
Prioritization should run on data, not complaint volume alone, though complaints are a legitimate input worth tracking. A workable process:
- Pull the essential inputs: speed runs (radar or tube counts), crash records with severity coding, and exposure data, pedestrian and cyclist volumes, school proximity, land use.
- Choose systemic or hotspot analysis depending on the pattern. Hotspot analysis finds the worst single intersections; systemic analysis finds shared risk factors across many locations that individually look unremarkable but collectively drive most serious crashes.
- Apply an equity filter so treatment does not default to whichever neighborhood has organized advocates. A pragmatic version of this workflow: identify high-risk corridors from crash and speed data, apply equity checks, select scalable low-regret countermeasures, and build in paired evaluation before and after.
- Select low-regret countermeasures first, changes that are cheap to reverse if wrong and cheap to scale if right, dynamic speed signs, temporary narrowing with planters, mobile ASE, while permanent design work moves through funding cycles.
A monitoring dashboard should lead with the numbers that show whether an intervention worked, not the numbers that are easiest to collect.
| Metric | What it shows | Reporting cadence |
|---|---|---|
| Mean and 85th percentile speed | Whether operating speeds actually dropped | Quarterly |
| Fatal and serious injury (KSI) crashes | The outcome that matters most | Annually, trend over 3 years |
| Citation or warning volume (enforcement sites) | Compliance and deterrence signal | Monthly |
| Public complaints or requests | Community perception and emerging hotspots | Monthly |
What Does the Evidence Say About Speeding Countermeasures?
Grant applications and city council briefs need citable numbers, not general assurances. A few carry particular weight because they combine scale with a documented before-and-after design.
- Victoria’s camera program produced a 47% reduction in death and serious injury crashes at treated intersections, alongside a 75% increase in mobile camera hours as part of a coordinated state strategy that paired cameras with public campaigns.
- A systematic review of speed-management strategies found consistent effectiveness across posted limits, road design changes, and modern enforcement technology, though effect sizes vary by context and are rarely directly comparable across studies.
- The NTSB’s safety study names automated enforcement, intelligent speed adaptation, and national leadership on speed limits as priority gaps the country has been slow to close.
- AAA Foundation attitude data shows most drivers respond to visible enforcement risk, 79% said a ticket threat would slow them down, which supports pairing enforcement visibility with any design or education push.
The caveat every practitioner should attach to these numbers: Victoria’s results reflect its own legal framework, camera density, and driving culture. A treatment that produced a 47% reduction there will not automatically produce the same number in a different jurisdiction with different baseline speeds, different enforcement law, or different road geometry. Treat these figures as evidence that the approach works, not as a guaranteed local outcome, and build paired before-and-after measurement into every project so local results are actually known rather than assumed.
How Drive With Care Supports Local Speed Reduction Efforts
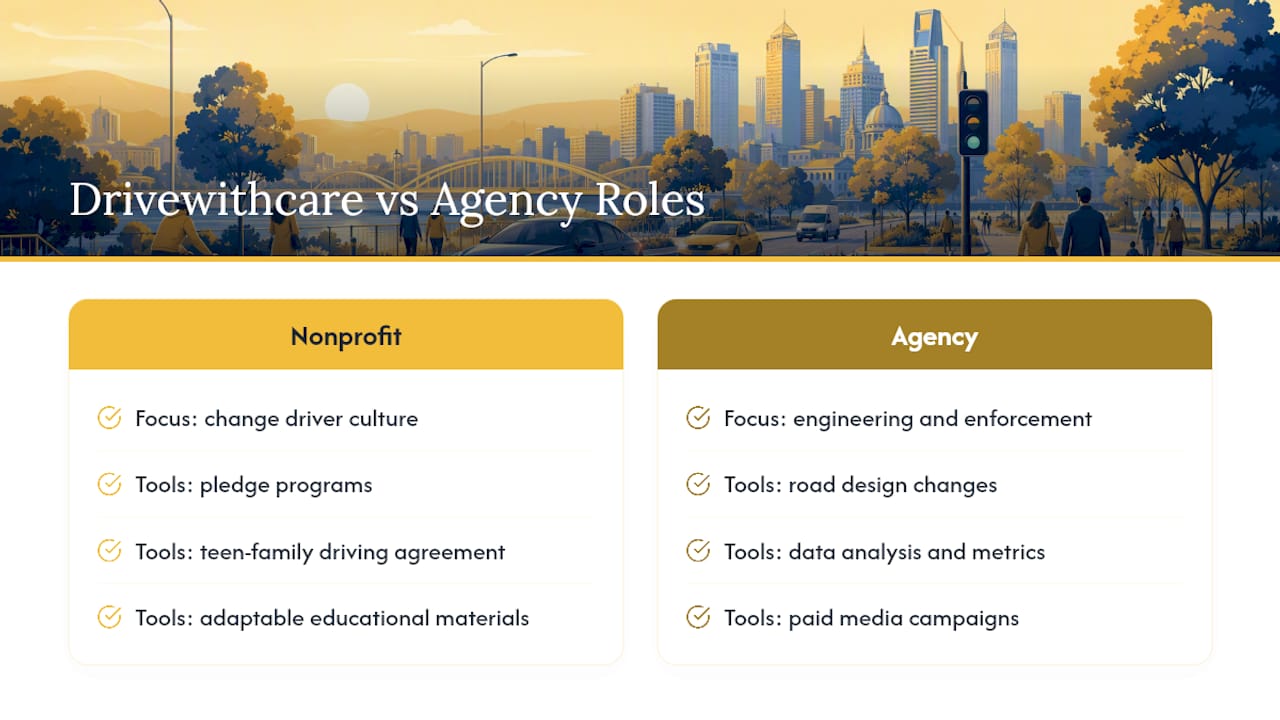
Engineering and enforcement change roads. Community programs change the culture drivers carry into them, and that is where Drivewithcare’s work fits. The organization’s core initiative, Safer Roads Now, focuses on the human-error side of the crash equation, addressing the behaviors and normalized attitudes that engineering alone cannot fix.
A pledge program can gather significant individual commitments to safer driving habits, giving agencies a low-cost way to extend a campaign’s reach past what paid media alone accomplishes. For practitioners building a local program, Drivewithcare offers usable starting points rather than a blank page: a teen and family driving agreement that mirrors the parent-teen contract approach shown to work in school-based programs, and broader educational resources and materials that agencies and driving schools can adapt locally.
Partnership works best when a nonprofit handles the personal-story and community-trust side while an agency handles the data and engineering side. Neither replaces the other; together they close the gap between a road that is technically safer and a community that actually believes it.
An Author’s Take on Fixing How Cities Treat Speed
The strategies that actually work are rarely the ones that get political attention first. Cities love announcing a new camera program because it’s visible and fast. They avoid road diets because they draw louder complaints, even when the design fix delivers a more durable speed reduction than enforcement alone ever will. Three moves matter most right now: run a temporary, low-cost design pilot on your worst corridor within 90 days; pair any enforcement rollout with advance public notice, since transparency is what earns acceptance; and build paired before-and-after measurement into every project from day one, not as an afterthought once someone asks whether it worked.
— Charles
How to Bring Speed-Reduction Programs to Your Community
Some nonprofits give community leaders and agencies something a standalone engineering study or enforcement grant cannot: a ready-made behavioral layer that turns technical fixes into public buy-in. Where a road diet or camera program needs a communications plan built from scratch, Drivewithcare’s existing pledge infrastructure and educational materials let you skip that build phase entirely.

The Safer Roads Now initiative and the Drive With Care Safety Pledge give local leaders a campaign structure that already has traction, driving schools, corporate sponsors, and local agencies have partnered on it before. If you’re planning a speed-reduction push and need the education and pledge component covered, request a partnership through Drivewithcare’s resources page or explore the teen and family driving agreement as a template for your own school or community outreach. Reach out to start the conversation about bringing these materials into your jurisdiction.
Sources
For deeper technical grounding on the frameworks and data cited above, these sources are worth bookmarking directly:
- Victoria: revenue from road safety camera fines / safety camera effectiveness
- NTSB safety study on speeding-related crashes and countermeasures

