
Traffic crashes and road safety in Richmond County, New York
Five years of crash deaths, a map of where serious crashes happened, the plans and grants that cover the county, and who to contact
From 2021 to 2025, police recorded 558 crashes in Richmond County, New York, that killed or seriously injured someone, and 12 half-mile stretches of road had 5 or more of them. 59 people lost their lives in traffic crashes in Richmond County, New York, from 2020 to 2024. That is fewer per person than the state or the country. Against the national pattern, the factor that stands out most is crashes involving people walking or biking: 47% of deaths.
Why these numbers are here
From crash data to safer roads
This page follows five steps. Each section below serves one of them, so you can read in order or go straight to the step you need.
- 1
See the pattern
Where and when serious crashes happened, and how many.
- 2
Understand the risk
Who was hurt and what was behind the crashes.
- 3
Reduce harm
Safety plans and funding, fixes proven to work, and what you can do.
- 4
Respond when harm occurs
What to do and where to get help after a crash.
- 5
Improve what we know
Where every number comes from, how current it is, and what it leaves out.
Traffic crash map of Richmond County
This map shows every injury crash with a known location in Richmond County (Staten Island), New York, from 2021 to 2025, from NYPD crash reports that New York City publishes. Red patches mark clusters of crashes. Colored lines and circles mark the street stretches and intersections with the most serious crashes (a death or serious injury).
The map counts crashes from NYPD’s records for 2021 to 2025, so its totals differ from the death counts below, which come from federal records for 2020 to 2024.
Select a colored line or circle for details. Zoom in to see each serious crash.
Injury crashes
5+, 4, 3 serious crashes
Fatal Serious injury
Map and analysis © 2026 Safety Behind the Wheel Foundation (drivewithcare.org). Crash records: NYPD, published by the City of New York (NYC Open Data). Priority corridors: NYC DOT. Neighborhood boundaries: NYC Department of City Planning. Road names: U.S. Census Bureau. Street map: © OpenStreetMap contributors. You may share this map with credit and a link to this page.
Roads with repeated serious crashes
Half-mile or shorter pieces of road with 3 or more serious crashes from 2021 to 2025. Within each group, places with more fatal and injury crashes come first. Select a place to see it on the map.
5 or more serious crashes · 12
4 serious crashes · 10
3 serious crashes · 30
Intersections with repeated serious crashes
Intersections with 2 or more serious crashes, or 12 or more injury crashes, from 2021 to 2025. Select a place to see it on the map.
3 or more serious crashes · 5
2 serious crashes · 41
12 or more injury crashes · 40
How to read this. A serious crash is one where someone died or police recorded a serious injury: a broken or dislocated bone, an internal or crush injury, severe bleeding or cuts, an amputation, paralysis, a severe burn, or a person who was unconscious or semiconscious. These are crash counts, not a risk score: busy roads have more crashes partly because more people drive on them. Two or three serious crashes at one place in five years can happen by chance, so places are shown in groups rather than ranked one by one.
Locations come from police reports and can be off by a short distance. 13 serious crashes and 155 other injury crashes in this borough had no location and are not on the map. The dashed purple lines, off at first, are NYC DOT’s Vision Zero priority corridors. Each crash on the map shows only its year and type.
Source: NYPD motor vehicle collisions, NYC Open Data; people involved (injury types); NYC DOT Vision Zero priority corridors; NYC neighborhood boundaries; U.S. Census Bureau TIGER/Line roads and boundaries. Street map © OpenStreetMap contributorsData: crashes 2021 to 2025Checked: Nov 18, 2026
Richmond County traffic crash statistics
In a place of about 495,000 people, a few crashes can move one year’s count a lot, so read the five-year total, not a single year. Federal files count deaths only; for serious injuries, use New York’s crash data tool (see our guide to state crash data portals).
Source: NHTSA FARS files (2020 to 2023 final files, 2024 annual report file), counted by Drive With Care; population from the U.S. Census BureauData: 2020 to 2024Checked: Nov 18, 2026
Who was affected
Fewer than half of fatalities happened inside a car, truck, van or bus. Compared with the state, a larger share involved people walking and people 65 or older, and a smaller share involved motorcycle riders.
How they were traveling
Age
Source: NHTSA FARS files (2020 to 2023 final files, 2024 annual report file), counted by Drive With Care; population from the U.S. Census BureauData: 2020 to 2024, five-year totalChecked: Nov 18, 2026
What was behind the crashes
Intersection crashes stand out. In Richmond County, 51% of deaths happened at or near an intersection, compared with 31% across the state.
How to read this. Each bar is a share of all deaths over the five years. One death can count in more than one row, so the rows do not add to 100%. Alcohol figures use NHTSA's own estimates for drivers whose test results are missing, as NHTSA does in its reports.
Source: NHTSA FARS files (2020 to 2023 final files, 2024 annual report file), counted by Drive With Care; population from the U.S. Census BureauData: 2020 to 2024, five-year totalChecked: Nov 18, 2026
Richmond County traffic safety plans
Richmond County is covered by the state’s safety plan. Cities, counties and regions can add their own safety action plans, often paid for with SS4A grants.
| Level | Plan | Goal | Status |
|---|---|---|---|
| State | Strategic Highway Safety Plan (New York State Department of Transportation) | Zero vehicle-related traffic fatalities and serious injuries | Found |
| Local | Safety plan or planning work by New York City Department of Transportation*, funded by SS4A in 2024 | Set by the plan | Not yet checked |
| Local | Safety plan or planning work by City of New York*, funded by SS4A in 2026 | Set by the plan | Not yet checked |
* Part of this city or town is in another county. A plan can exist without an SS4A grant. Under our Plan Watch rules, we ask the agency before we publish "not found" as final, and we post its reply.
Source: FHWA, SHSP database; USDOT SS4A award listsData: plans as postedChecked: Nov 18, 2026
The money
From 2022 to 2026, four SS4A grants went to local governments in Richmond County, for a total of $65,920,342 in federal funds.
| Year | Who received it | Grant type | What it pays for | Federal funds |
|---|---|---|---|---|
| 2022 | New York City* | Implementation | Safety projects (no description in the USDOT list) | $21,481,306 |
| 2023 | New York City Department of Transportation* | Implementation | Safety projects (no description in the USDOT list) | $29,750,000 |
| 2024 | New York City Department of Transportation* | Planning and demonstration | Demonstration or other planning work | $11,920,000 |
| 2026 | City of New York* | Planning and demonstration | Improving Emergency Response | $2,769,036 |
* Part of this city or town is in another county, so its grant is listed on each county’s page.
Regional planning groups, tribes and other agencies also received SS4A grants, and some cover more than one county. See every SS4A grant in New York.
Source: USDOT SS4A award lists, FY2022 to FY2026Data: awards 2022 to 2026Checked: Nov 18, 2026
What works for Richmond County's top problems
We matched the three problems that stand out most against the national pattern to fixes with strong evidence.
People walking or biking: 47% of deaths
Make crossings and roadsides safer
- Pedestrian refuge islands cut pedestrian crashes by 56% (FHWA), pedestrian hybrid beacons by 55% (FHWA) and rectangular rapid flashing beacons by up to 47% (FHWA).
- Sidewalks cut crashes involving people walking along the road by 65% to 89% (FHWA). Lower speed limits get 4 stars for pedestrian safety (NHTSA).
- Read: Pedestrian hybrid beacons, rapid flashing beacons at crosswalks and bike lane separators and refuge islands.
Intersections: 51% of deaths
Make intersections safer
- Turning a two-way stop into a roundabout cut crashes with deaths or injuries by 82%; turning a signal into a roundabout cut them by 78% (FHWA).
- Low-cost upgrades at stop-controlled intersections, such as better signs and markings, cut crashes with deaths or injuries at rural intersections by 27% (FHWA). Leading pedestrian intervals cut pedestrian crashes at intersections by 13% (FHWA).
- Read: Crosswalk markings and yield lines and countdown and accessible pedestrian signals.
Speeding: 39% of deaths
Slow traffic where people are hurt
- Lower speed limits 5 stars, speed safety cameras 5 stars and dynamic speed feedback signs 5 stars; high-visibility enforcement 4 stars (NHTSA). Where cameras may be used depends on state law.
- Read: Speed feedback signs: where they work and how to ask for one and camera laws by state.
Source: NHTSA Countermeasures That Work, 11th edition; FHWA Proven Safety CountermeasuresData: as publishedChecked: Nov 18, 2026
Help after a crash
- Get the police crash report. Ask the police agency that handled the crash how to request a copy. You will usually need the date, the place and the report number.
- Help with costs after a crime. Every state has a crime victim compensation program that may help when a crash involved a crime, such as DUI or hit and run. Find New York's program and how to apply on the Office for Victims of Crime map.
- Brain injury help. Find brain injury support for New York through the Brain Injury Association of America. You can also go straight to bianys.org. The National Brain Injury Information Center is 1-800-444-6443.
- Our recovery guides. Start with Beyond the concussion and post crash care in the first minutes, or read and share stories on the Story Wall.
Stories appear on a place page only with the family's written consent. We never match a story to a crash record.
Source: Office for Victims of Crime; Brain Injury Association of AmericaData: as postedChecked: Nov 18, 2026
What you can do
- Report a problem on a state road. Contact the New York State Department of Transportation. Call 911 for an emergency.
- Find out who owns the road. State routes belong to the state. Most other roads belong to Richmond County or your city, town or township. Ask them about signs, crossings, lighting and speed.
- Ask about your local safety plan. If your town, county or region received an SS4A grant, ask for its safety action plan and its yearly progress report.
- Bring people together. Our guides on building a coalition and running a community program show how.
Questions about road safety in Richmond County
How many people die in traffic crashes in Richmond County, New York?
59 people died in traffic crashes in Richmond County from 2020 to 2024, including 13 in 2024, according to federal crash records (NHTSA FARS). That is about 2.4 deaths per 100,000 people a year, compared with 5.6 in New York and 12.3 in the United States.
Which roads in Richmond County have repeated serious crashes?
From 2021 to 2025, 12 half-mile stretches of road in Richmond County each had 5 or more crashes that killed or seriously injured someone, according to records from the NYPD motor vehicle collisions, NYC Open Data. They include stretches of Hylan Blvd in New Dorp-Midland Beach, Forest Ave in Mariner's Harbor-Arlington-Graniteville and Victory Blvd in New Springville-Willowbrook-Bulls Head-Travis. These are crash counts, not a risk ranking: busy roads have more crashes partly because more people drive on them. See every stretch and intersection on the crash map.
Does Richmond County have a road safety plan?
Richmond County is covered by the state's safety plan. From 2022 to 2026, four federal Safe Streets and Roads for All (SS4A) grants went to local governments in Richmond County, for a total of $65,920,342 in federal funds. See the plans and the grants.
Sources and dates
- NHTSA, FARS national files 2020 to 2024 (2020 to 2023 final, 2024 annual report file)
- U.S. Census Bureau, Vintage 2024 county population estimates
- FHWA, SHSP database: New York
- New York State Department of Transportation, Strategic Highway Safety Plan
- USDOT, SS4A award lists FY2022 to FY2026
- NHTSA, Countermeasures That Work: speeding
- NHTSA, Countermeasures That Work: pedestrians
- FHWA, Proven Safety Countermeasures: pedestrian crossings and walkways
- FHWA, Proven Safety Countermeasures: roundabouts
- FHWA, Proven Safety Countermeasures: stop-controlled intersections
- Office for Victims of Crime, Help in Your State
- Brain Injury Association of America, Find Your BIA
All checked: Nov 18, 2026Next refresh: April 2027 (NHTSA estimates) and fall 2027 (grants)
This page offers general education, not legal advice. Numbers for small places swing from year to year, so we show five-year totals and do not rank places. In an emergency, call 911.
Road safety data in nearby counties
- Explore road safety data in Kings County
- Explore road safety data in Queens County
- Explore road safety data in Hudson County, New Jersey
- Explore road safety data in Middlesex County, New Jersey
- Explore road safety data in Monmouth County, New Jersey
- Explore road safety data in Union County, New Jersey
- See road safety data for all of New York
Keep learning
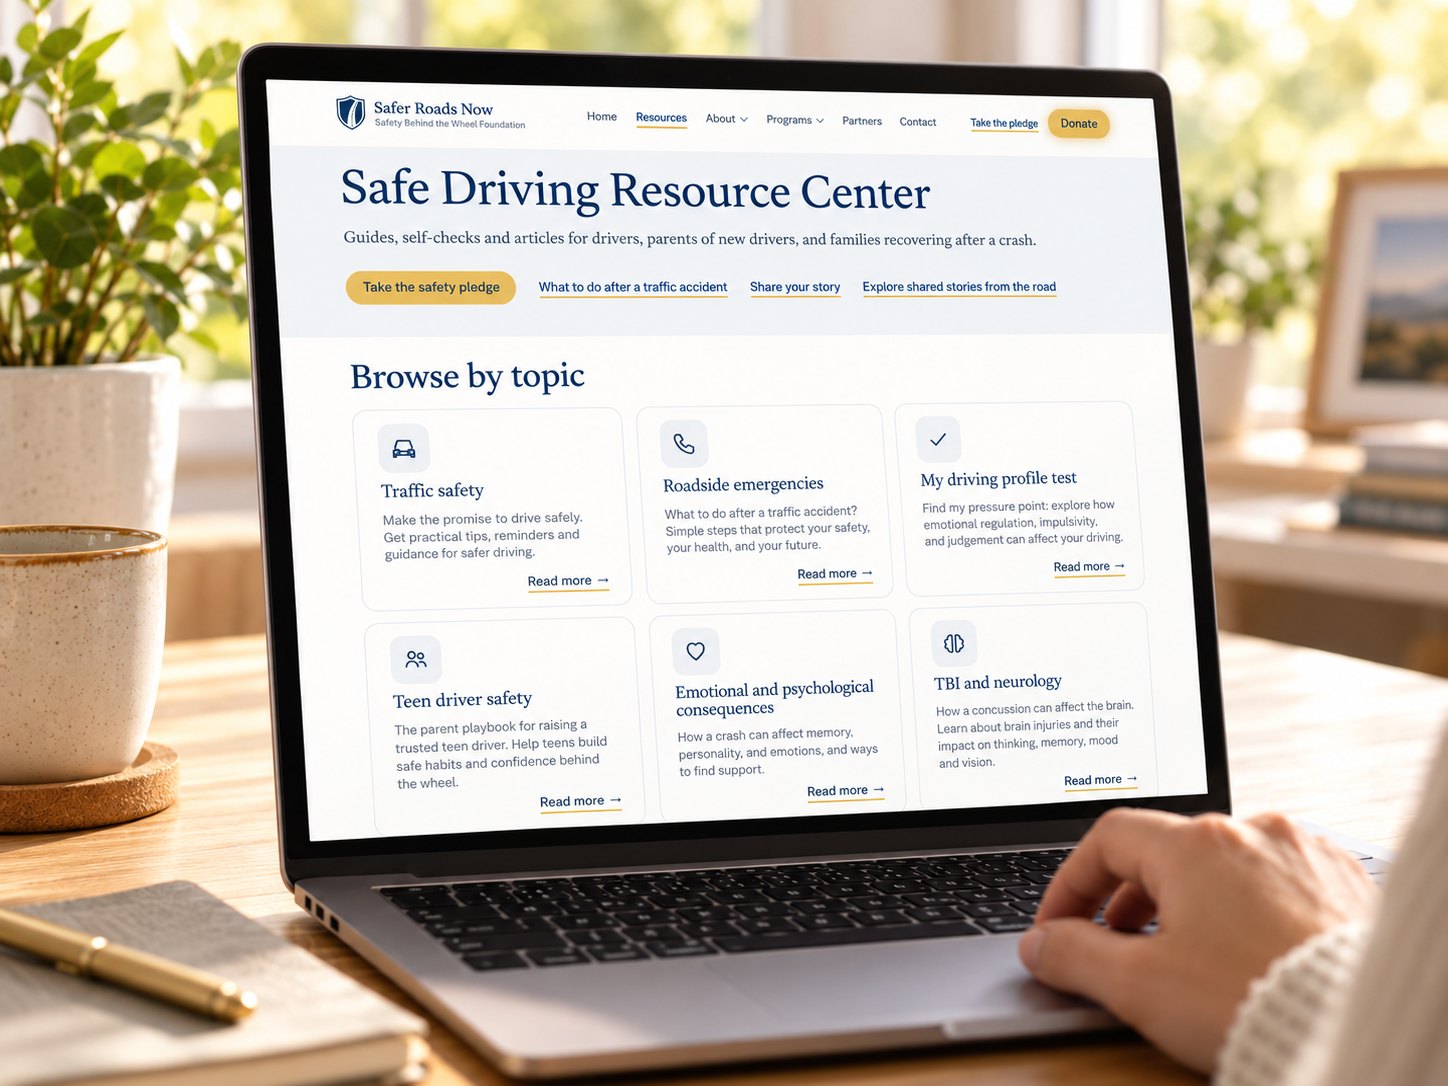
Safe Driving Resource Center
Guides, self-checks and articles for drivers, parents of new drivers, and families recovering after a crash.
Special thanks to our contributors
We appreciate the professionals, experts, and community members who share their knowledge and perspectives to help make this resource better. Your insights are always welcome and appreciated.
Have professional expertise, firsthand experience, or a perspective that could make this resource better?
We welcome your input. Your knowledge and experience can help us make this resource more useful, accurate, and meaningful to the people who rely on it.
Thank you. Your contribution is on its way.
We’re grateful you took the time to share your knowledge with us. Our team reviews every contribution with care. If it helps improve this resource, we’ll update the page and recognize you the way you chose.