
Road safety where you live
Eight public sources that show how safe your roads are and what is being done, in plain words
Government agencies publish a great deal about road safety: crash counts, state plans, grant awards and lists of fixes that work. Almost all of it is written for agencies, not for the people who use the roads.
This guide explains the eight sources we use most. For each one you will see what it is, what you can learn in five minutes, how to look up your own state or town, and what it cannot tell you. Pick your starting point below.
Find your starting point
The eight sources
Each card answers the same four questions. Use the links to look up your own place, and read our longer guide when you want more.
NHTSA
FARS: the count of every traffic death
- What it is
- A record of every traffic fatality in the United States since 1975, built from police reports and other records.
- What you can learn in five minutes
- How many traffic fatalities happened in your state or county each year, and whether each person was in a vehicle, on a motorcycle, walking or cycling. The latest annual file counts 39,254 deaths in 2024; NHTSA's early estimate for 2025 is 36,640 (NHTSA, April 2026).
- How to look up your place
- Open NHTSA's State Traffic Safety Information and click your state, or use FIRST (next card) for a county or city.
- What it cannot tell you
- It does not count injuries, near misses, or what happened to families afterward. Final numbers arrive about two years after the year ends.
NHTSA
FIRST: build your own crash table
- What it is
- A free query tool that makes tables, charts and maps from FARS and from a national sample of injury crashes.
- What you can learn in five minutes
- A table of deaths by year for your county, or by age, time of day, or type of road user.
- How to look up your place
- Go to cdan.dot.gov/query, pick a state, then a county or city. County and city choices work only for fatal crashes.
- What it cannot tell you
- It cannot answer injury questions for one town, because the injury data is a national sample. NHTSA says it works best in Chrome or Edge.
Your state DOT
Your state's safety plan (SHSP)
- What it is
- Each state, Washington, D.C. and Puerto Rico writes a Strategic Highway Safety Plan that names its biggest crash problems and who will work on them.
- What you can learn in five minutes
- Your state's top problems, called emphasis areas, and its goal, such as a yearly cut in deaths.
- How to look up your place
- FHWA links to all 52 plans and their walker and cyclist safety assessments on its SHSP resources page.
- What it cannot tell you
- It does not show your street, or whether the plan's steps happened. Some FHWA links are out of date (North Dakota's opens Kentucky's page), so check your state DOT's site too.
FHWA
State safety spending and targets (HSIP)
- What it is
- Federal money each state spends on road fixes such as rumble strips, roundabouts and lighting. Each state reports on it every year and sets five safety targets.
- What you can learn in five minutes
- What kinds of projects your state built, and whether it met its targets. In the latest check, for 2023, 18 of 52 states met or made significant progress (FHWA).
- How to look up your place
- FHWA posts every state's yearly HSIP report. Our Plan Watch scorecard shows the target results for all states in one table.
- What it cannot tell you
- Reports are long PDFs, and each state sets its own targets, so FHWA warns against drawing conclusions from the results alone.
USDOT
Safe Streets and Roads for All grants (SS4A)
- What it is
- A federal grant program that awarded $4.9 billion from 2022 to 2026 to more than 2,200 communities to write safety action plans and build fixes (USDOT).
- What you can learn in five minutes
- Whether your town, county or region got a grant, how much, and for what. In 2026, 95 projects focused mainly on care after a crash (USDOT).
- How to look up your place
- USDOT posts an awards map and a list for each year. Our place pages list every award in the place.
- What it cannot tell you
- It does not tell you whether a plan is being carried out. Money after 2026 is undecided; the 2026 awards will be the last unless Congress acts (NACo).
NHTSA
Countermeasures That Work
- What it is
- NHTSA's guide that rates programs aimed at driver behavior from 1 to 5 stars, across 11 topics such as impaired driving, speeding, seat belts and teen drivers.
- What you can learn in five minutes
- Which ideas have strong evidence. Publicized sobriety checkpoints and speed safety cameras both get 5 stars; mass media campaigns on drunk driving get 2 (impaired driving, speeding).
- How to look up your place
- Pick a chapter in the online guide (11th edition).
- What it cannot tell you
- It does not cover road design. For that, see FHWA's Proven Safety Countermeasures. Neither tells you what your own town is doing.
iRAP
Star Ratings for road design
- What it is
- A method from the International Road Assessment Programme, a charity, that rates how safe a road's design is, up to 5 stars, for people in cars, on motorcycles, on bikes and on foot.
- What you can learn in five minutes
- What makes a road safer by design: medians, safe crossings, forgiving roadsides and speeds that fit the people using the road.
- How to look up your place
- iRAP's Safety Insights Explorer shows rated roads in 84 countries. The U.S. program, usRAP, had its website down for maintenance on Nov 17, 2026.
- What it cannot tell you
- It rates a road's design, not what has happened on it. To see where people were hurt, use your region's high injury map.
City, county or region
Your region's high injury map
- What it is
- A map, made by a city, county or regional planning agency, of the short list of streets where most deaths and serious injuries happen.
- What you can learn in five minutes
- Whether the streets you use every day are on it. In Southern California, 65% of deaths and serious injuries happened on 5.5% of the network (SCAG); in Tampa, 73% of deaths happened on 24% of road miles (Esri).
- How to look up your place
- Search for your city or region plus "high injury network", or look inside its safety action plan. One example is the Philadelphia region map.
- What it cannot tell you
- Each agency uses its own method and years, so maps cannot be compared. A street that is not on the map can still be dangerous.
Source: the agencies linked in each cardData: latest available, as named in each cardChecked: Nov 17, 2026
For parents
Teen drivers and young walkers are where many parents start. The numbers show the risk in your state, and the evidence shows what helps.
Start with: FARS for teen driver deaths in your state, your high injury map for school routes, and Countermeasures That Work for what helps new drivers.
For families after a crash
Numbers can feel cold after a loss or a serious injury. They still matter, because they show where fixes and help are going. In 2026, 95 SS4A projects focused mainly on care after a crash.
Start with: SS4A to see what your area is funding, then your place page for help near you.
For local leaders
Council members, school boards, police and neighborhood groups can use these sources to choose priorities and ask for fixes that work.
Start with: your state plan and high injury map, then match problems to fixes with Countermeasures That Work and FHWA’s Proven Safety Countermeasures.
For reporters and teachers
See it for one place
Our place pages bring these sources together for every state and county, with each number dated and sourced. Pick your state below, then your county from the state page. Plan Watch shows how every state did against its own safety targets.
- Alabama
- Alaska
- Arizona
- Arkansas
- California
- Colorado
- Connecticut
- Delaware
- District of Columbia
- Florida
- Georgia
- Hawaii
- Idaho
- Illinois
- Indiana
- Iowa
- Kansas
- Kentucky
- Louisiana
- Maine
- Maryland
- Massachusetts
- Michigan
- Minnesota
- Mississippi
- Missouri
- Montana
- Nebraska
- Nevada
- New Hampshire
- New Jersey
- New Mexico
- New York
- North Carolina
- North Dakota
- Ohio
- Oklahoma
- Oregon
- Pennsylvania
- Rhode Island
- South Carolina
- South Dakota
- Tennessee
- Texas
- Utah
- Vermont
- Virginia
- Washington
- West Virginia
- Wisconsin
- Wyoming
How we keep this current
Every number on these pages shows its source, the years the data covers and the date we last checked it. Federal pages move and change, so we recheck on a set calendar: each April for NHTSA’s early estimates, after August 31 for state HSIP reports, and each fall for new grant awards.
If a page we cite moves or disappears, we say so on our page rather than quietly changing the number.
Want more on crash data? Browse every traffic safety data guide in our library, or learn how to find and read your area's crash maps.
Sources
- NHTSA, Early Estimate of Motor Vehicle Traffic Fatalities and Fatality Rate in 2025 (DOT HS 813 800), April 2026
- NHTSA, Fatality Analysis Reporting System (FARS)
- NHTSA, Fatality and Injury Reporting System Tool (FIRST)
- NHTSA, State Traffic Safety Information
- FHWA, SHSP Resources: state plans and walker and cyclist safety assessments
- FHWA, HSIP Reporting: state reports
- FHWA, State Safety Performance Targets (CY 2023 assessment)
- USDOT, Safe Streets and Roads for All grant program
- USDOT, 2026 SS4A awards
- National Association of Counties, final SS4A awards, Oct 2026
- NHTSA, Countermeasures That Work, 11th edition
- FHWA, Proven Safety Countermeasures
- International Road Assessment Programme (iRAP)
- Southern California Association of Governments, Regional High Injury Network
- Esri, Tampa maps traffic safety (High Injury Network)
All pages opened: Nov 17, 2026
This guide offers general education, not legal advice. Data and programs change, so check the original source before you rely on a number. In an emergency in the United States, call 911.
Keep learning
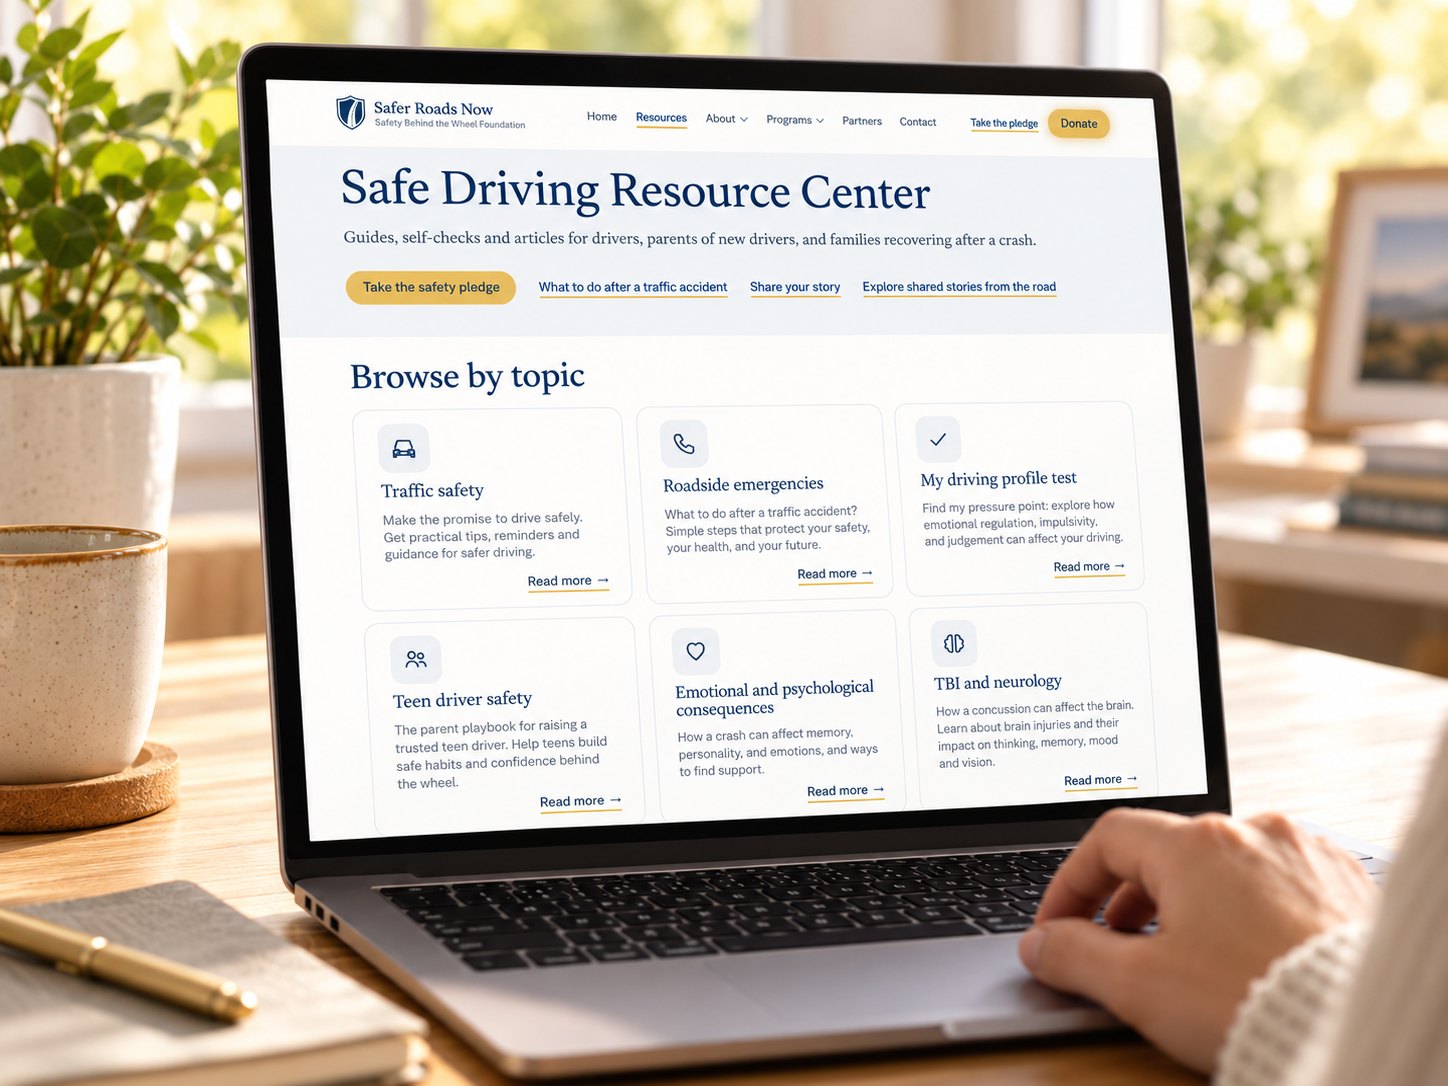
Safe Driving Resource Center
Guides, self-checks and articles for drivers, parents of new drivers, and families recovering after a crash.
Special thanks to our contributors
We appreciate the professionals, experts, and community members who share their knowledge and perspectives to help make this resource better. Your insights are always welcome and appreciated.
Have professional expertise, firsthand experience, or a perspective that could make this resource better?
We welcome your input. Your knowledge and experience can help us make this resource more useful, accurate, and meaningful to the people who rely on it.
Thank you. Your contribution is on its way.
We’re grateful you took the time to share your knowledge with us. Our team reviews every contribution with care. If it helps improve this resource, we’ll update the page and recognize you the way you chose.